With No Foreseeable Headwinds, it’s Steady as She Goes
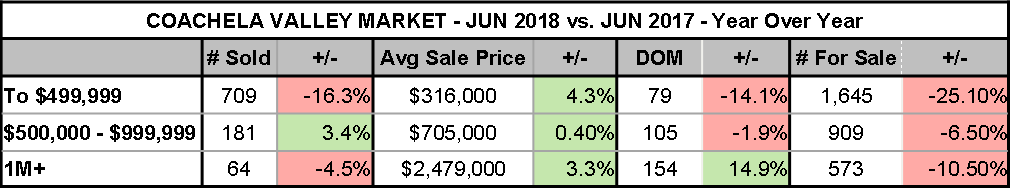
Trendvision’s® most recent year-over-year (2018 vs. June 2017) market statistics indicate that Coachella Valley’s Average Sales Prices were up (+3.4%) for homes priced from $500,000 to $999,999, and down (-16.3%) for homes under $499,999, and (-4.5%) for those over 1M+.
But, while slower sales in the warmer months is not uncommon, what is surprising is that the Average Sold Prices are up for homes in every pricing category, and Days on Market continue to decrease year over year for homes priced up to $999,999. Homes over 1M+ did sit on the market an average of 154 days, or (+14.9%) longer than they did in June 2017.
Although you would expect inventory of homes for sale to decrease every June, what is notable in this report is that the Number of Homes for Sale are as much as (-25%) fewer for those priced to $499,999, (-6.5%) for homes priced $500,000-$999,999, and those over 1M+ are down by (-10.5%). With inventory continuing to be tight, prices are expected to either remain steady or increase.
The bottom line is, that the Coachella Valley housing market is stable and is not notably deviating from its course since January 2018. With interest rates still attractive, summer may be the best opportunity to buy a home in the Greater Palm Springs area. At the very least, you may want to talk to me about the good deals available now.
Cities of La Quinta, Indio—June Home Average Sold Prices Rise, and They’re Selling Faster
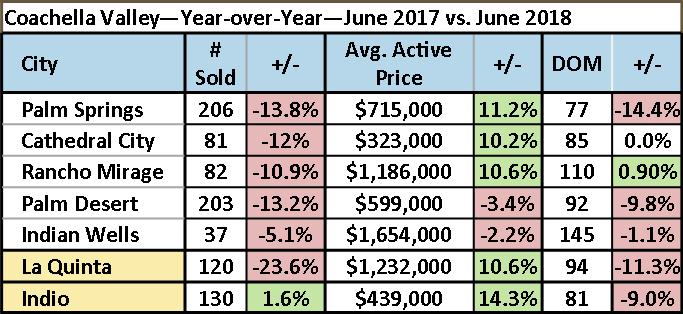
According to TrendVisions™ June home statistics the market is strong and steady, and although every city EXCEPT Indio, experienced decreases in the Number of Homes Sold, 7 of 10 cities had increases in the Average Sale Listing Price, with 6 of them in the double digits.
Half of all the cities sold homes quicker, with 4 showing increased days on market and 1, Cathedral City, not changing at all.
Cities By the Numbers
- Cities with the highest percentage increases in Average Sale Price: Bermuda Dunes (15.6%); Indio (14.3%); Palm Springs (11.2%); La Quinta (10.6%); Rancho Mirage (10.65%); Cathedral City (10.2%).
- Cities with the greatest percentage of increases in the Number of Homes Sold: Indio (1.6%).
- Cities with the greatest percentage of decreases in Number of Homes Sold: Bermuda Dunes (-40.9%); La Quinta (-23.6%); Palm Springs (-13.8%); Palm Desert (-13.2%); Cathedral City (-12%); Desert Hot Springs (11.5%); Rancho Mirage (-10.9%).
- Cities with the greatest percentage decreases in Days on Market: Palm Springs (-14.4%); La Quinta (-11.3%); Indian Wells (-11%); Palm Desert (-9.8%); Indio (-9%).
For detailed report of home prices in your neighborhood contact Donna Ambrose at (m) 206-755-9823 or email donna.ambrose@kw.com.
July 2018 Trendvision® Reports were used to calculate this report and were based on data available at the end of June 2018. All reports presented are based on data supplied by the Desert Area MLS. Neither the Association nor its MLS guarantees or is in anyway responsible for its accuracy. Data maintained by the Association of its MLSs may not reflect all real estate activities in the market. Information deemed reliable but not guaranteed. Donna Ambrose, REALTOR®, Keller Williams Realty, La Quinta, CA, CalBre##02038351